
The following analysis of the Salt Lake County real estate market is provided by Windermere Real Estate Principal Economist Jeff Tucker. We hope that this information may assist you with making better-informed real estate decisions.
ECONOMIC OVERVIEW
The U.S. economy continued its streak of impressively resilient growth in the third quarter of 2026, despite higher energy costs from the war in Iran rippling through the economy. But that growth has come at a cost: higher interest rates. A perfect storm of inflation, large fiscal deficits, and competing demands for capital from the AI investment boom conspired to push the 10-year Treasury yield from an average of 4.47% in June to 4.99% in September, with no signs of cooling in sight.
Higher Treasury yields translate directly into higher borrowing costs for homebuyers. Mortgage rates averaged 6.68% in the third quarter, up from 6.41% in the second quarter and 6.11% in the first. Meanwhile, weekly mortgage rate averages soared above 7.25% by the end of the quarter, a level not seen since 2023.
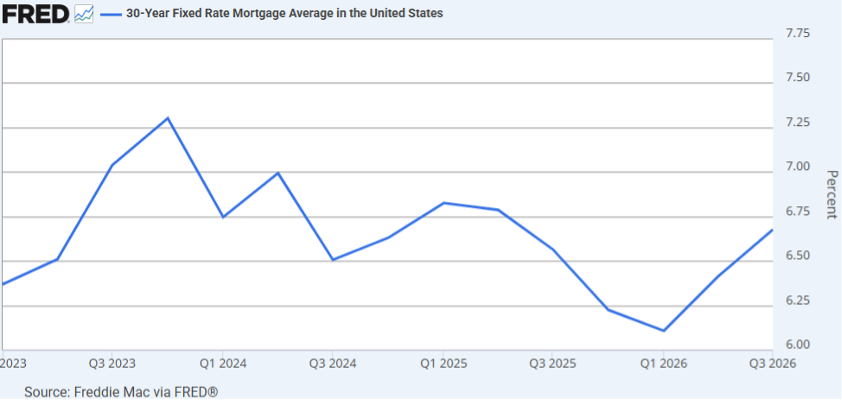
Source: Freddie Mac via FRED.
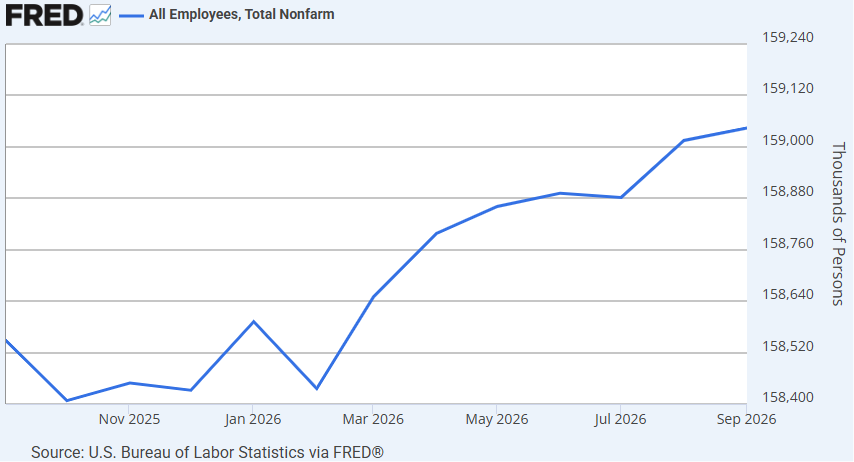
Payrolls continued to climb in the third quarter, although at a slower pace than earlier this year. Nonfarm employment totaled 159,044,000 jobs at the end of September, an increase of 152,000 from the end of the second quarter. That’s down from the 242,000 jobs added in Q2 and the 218,000 added in Q1. The slowdown may be an early sign of cooling demand for workers as companies grapple with higher costs for everything from fuel to interest on loans.
While the housing market weathered the early headwinds of rising mortgage rates during the spring selling season, cracks began to show in the third quarter. Inventory growth accelerated in many markets, while sales activity and price gains slowed or declined. High home prices and borrowing costs have kept affordability stretched to the limit, and increases in mortgage rates during the third quarter pushed homeownership even further out of reach for many buyers who might have otherwise purchased a home in the summer or fall. Looking ahead, growing inventory will continue to put pressure on sellers to cut prices while giving buyers more options and greater negotiating power.
Active Listings
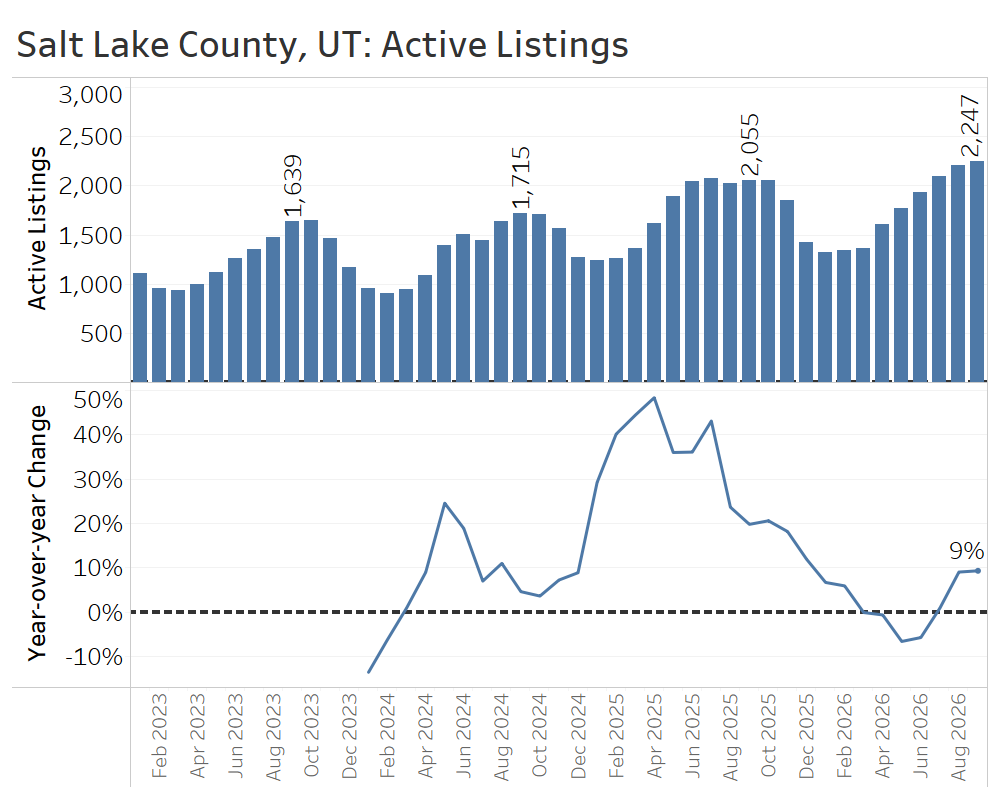
In the third quarter of 2026, Salt Lake County’s market shifted modestly back towards buyers after moving in sellers’ favor earlier this year.
Active listings ended September 9% above year-ago levels, with inventory growth resuming after a few months of declines this spring.
Median Sold Price
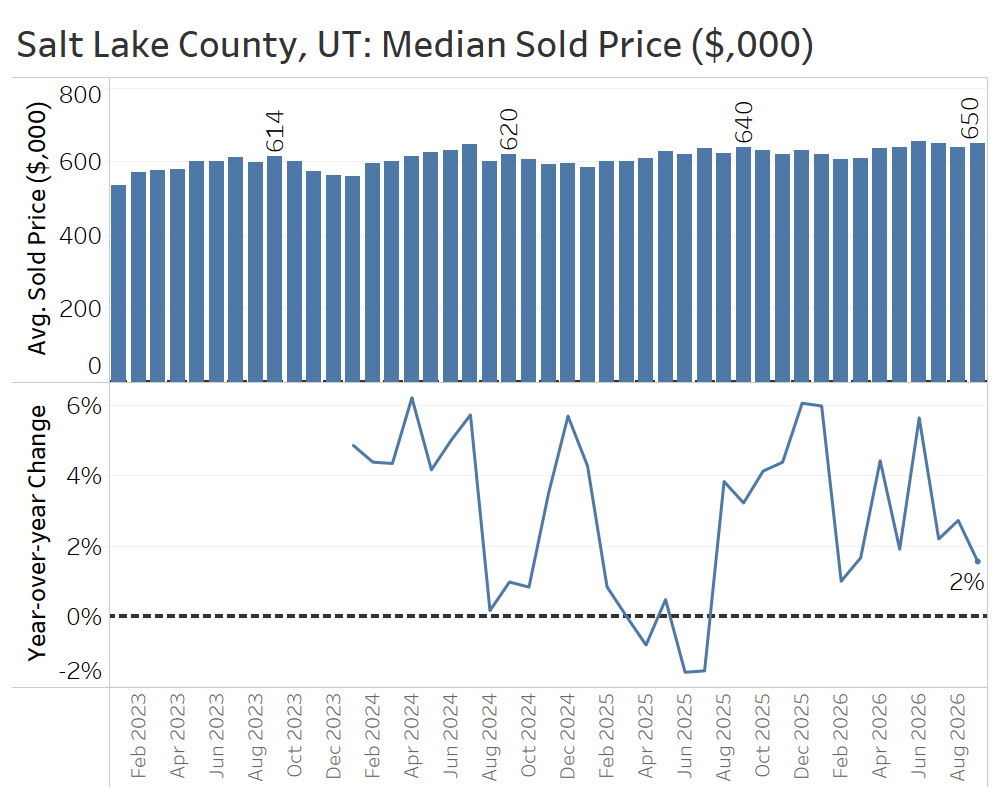
Median sale prices continued to rise year over year throughout the third quarter, although the pace of growth slowed to just 2% by September.
New Listings
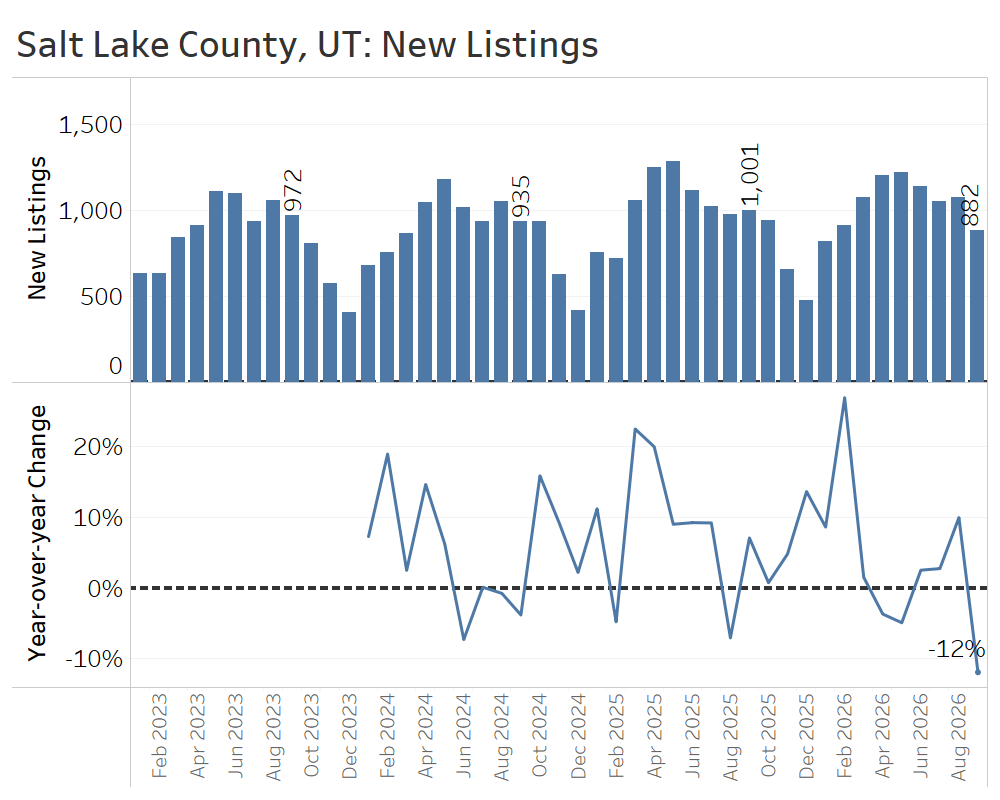
New listings in the third quarter were nearly unchanged from a year earlier, totaling just over 3,000. September listings, however, saw a dramatic dropoff of 12% below September 2025 levels. Data from the fourth quarter should help clarify whether that decline signals a broader trend or is simply a temporary blip.
Closed Sales
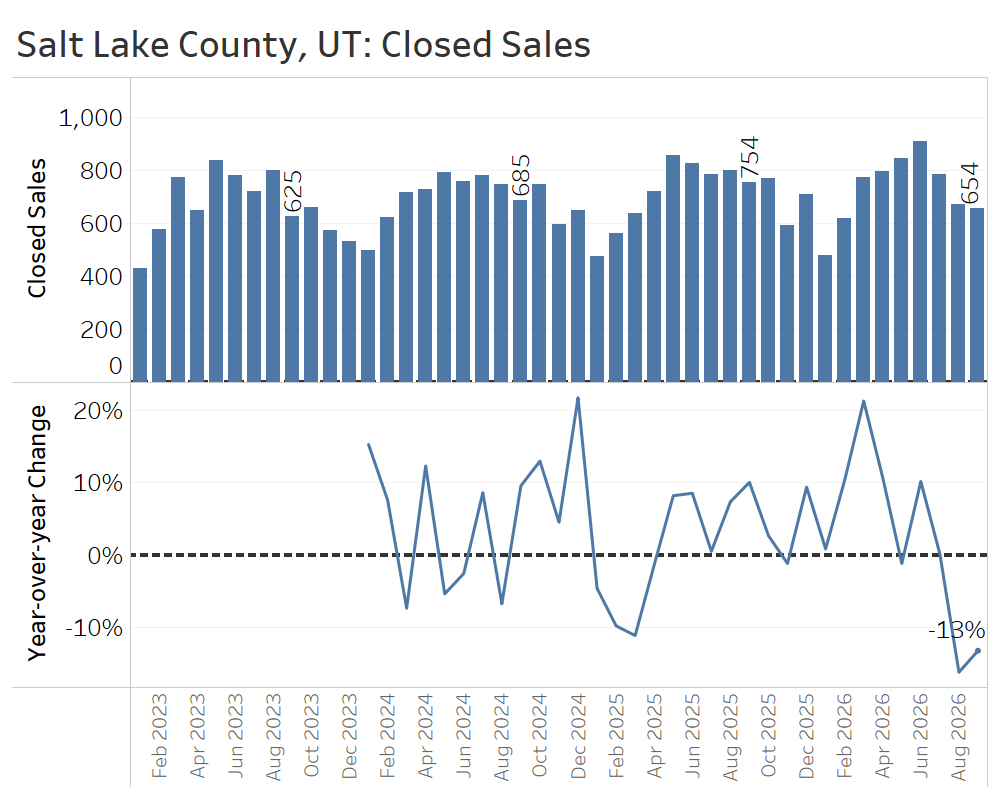
After an impressive 5% year-over-year increase in the second quarter, closed sales declined in the third quarter, finishing about 10% below the same period last year.
Days on Market
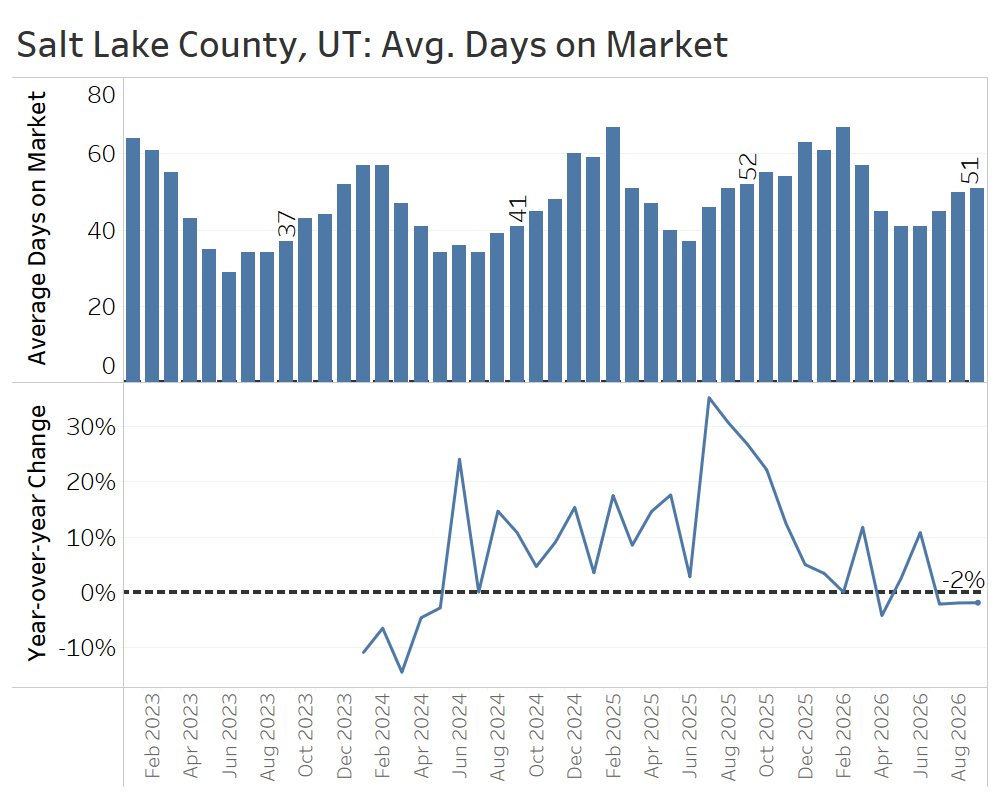
Days on market closely matched year-ago levels, down by just one day from 52 last September to 51 days this September.
CONCLUSIONS
The third quarter marked a sharp reversal from Salt Lake County’s stronger demand in the second quarter. In particular, closed sales fell well below year-ago levels as buyers appeared to pull back amid rising interest rates and inflation. Still, home prices have held onto their gains, suggesting sellers are holding firm on asking prices while waiting to see whether demand rebounds.
In the third quarter of 2026, homebuyer demand began to buckle under the pressure of rising mortgage rates and widespread inflation. Inventory growth accelerated or shifted from negative to positive in nearly every market covered in this report, as buyers pulled back while sellers kept bringing homes to the market. Many would-be buyers have already waited years in hopes of better conditions, and with mortgage rates reaching their highest levels in three years, many may put their plans on hold for another season.
As the market enters the fourth quarter, traditionally the quietest time of year for home sales, buyers who can afford to forge ahead despite higher mortgage rates will find a plethora of options. Sellers, meanwhile, face a difficult choice: try to find the right buyer now or wait for the spring selling season in hopes of stronger demand.
With mortgage rates and the economy especially difficult to predict amid ongoing geopolitical turmoil, sellers need to lean on their agents’ expertise more than ever. In a changing market, realistic pricing and presenting a home in its best possible light through staging, photography, and marketing can make a meaningful difference in attracting buyers.
Sources: TrendGraphix analysis of NWMLS, RMLS, Spokane MLS, Coeur d’Alene MLS, MetroList MLS, and Wasatch Front MLS data. All charts are restricted to single-family residential home listings and sales.
About Jeff Tucker
As Principal Economist for Windermere Real Estate, Jeff Tucker is responsible for analyzing and interpreting economic data and its impact on the real estate market on both a local and national level. Jeff has over 10 years of experience as an economist at companies such as Zillow, Amazon, and AirDNA.

